Decomposition Module (API Reference)
The scikitplot.decomposition module includes plots built specifically
for scikit-learn estimators that are used for dimensionality reduction
e.g. PCA. You can use your own estimators, but these plots assume specific
properties shared by scikit-learn estimators. The specific requirements are
documented per function.
-
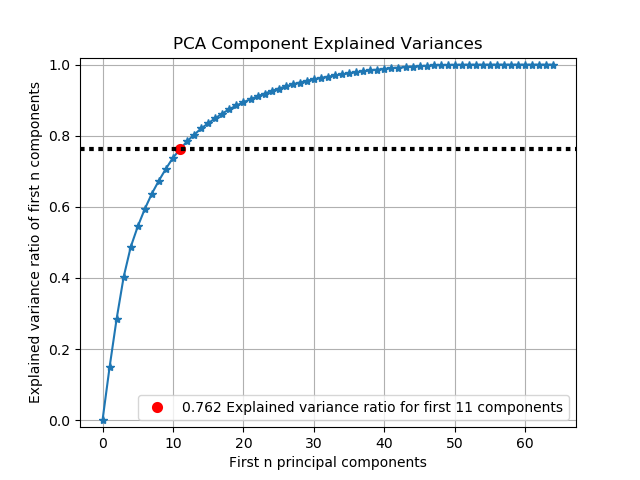
scikitplot.decomposition.plot_pca_component_variance(clf, title='PCA Component Explained Variances', target_explained_variance=0.75, ax=None, figsize=None, title_fontsize='large', text_fontsize='medium')¶ Plots PCA components’ explained variance ratios. (new in v0.2.2)
Parameters: - clf – PCA instance that has the
explained_variance_ratio_attribute. - title (string, optional) – Title of the generated plot. Defaults to “PCA Component Explained Variances”
- target_explained_variance (float, optional) – Looks for the minimum number of principal components that satisfies this value and emphasizes it on the plot. Defaults to 0.75
- ax (
matplotlib.axes.Axes, optional) – The axes upon which to plot the curve. If None, the plot is drawn on a new set of axes. - figsize (2-tuple, optional) – Tuple denoting figure size of the plot
e.g. (6, 6). Defaults to
None. - title_fontsize (string or int, optional) – Matplotlib-style fontsizes. Use e.g. “small”, “medium”, “large” or integer-values. Defaults to “large”.
- text_fontsize (string or int, optional) – Matplotlib-style fontsizes. Use e.g. “small”, “medium”, “large” or integer-values. Defaults to “medium”.
Returns: - The axes on which the plot was
drawn.
Return type: ax (
matplotlib.axes.Axes)Example
>>> import scikitplot as skplt
>>> pca = PCA(random_state=1)
>>> pca.fit(X)
>>> skplt.decomposition.plot_pca_component_variance(pca)
<matplotlib.axes._subplots.AxesSubplot object at 0x7fe967d64490>
>>> plt.show()
- clf – PCA instance that has the
-
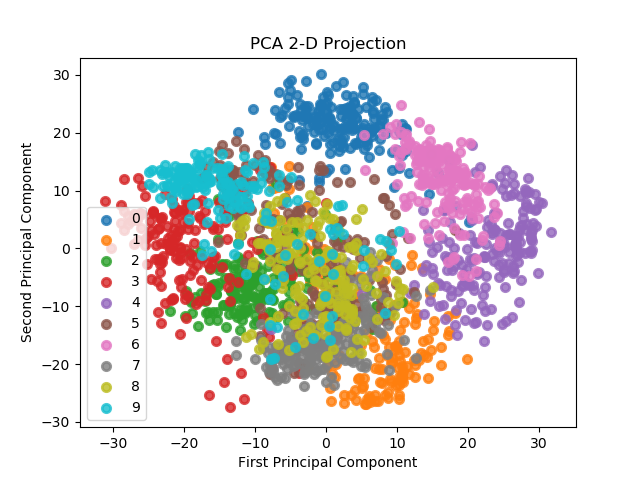
scikitplot.decomposition.plot_pca_2d_projection(clf, X, y, title='PCA 2-D Projection', biplot=False, feature_labels=None, ax=None, figsize=None, cmap='Spectral', title_fontsize='large', text_fontsize='medium')¶ Plots the 2-dimensional projection of PCA on a given dataset.
Parameters: - clf – Fitted PCA instance that can
transformgiven data set into 2 dimensions. - X (array-like, shape (n_samples, n_features)) – Feature set to project, where n_samples is the number of samples and n_features is the number of features.
- y (array-like, shape (n_samples) or (n_samples, n_features)) – Target relative to X for labeling.
- title (string, optional) – Title of the generated plot. Defaults to “PCA 2-D Projection”
- biplot (bool, optional) – If True, the function will generate and plot biplots. If false, the biplots are not generated.
- feature_labels (array-like, shape (n_classes), optional) – List of labels
that represent each feature of X. Its index position must also be
relative to the features. If
Noneis given, then labels will be automatically generated for each feature. e.g. “variable1”, “variable2”, “variable3” … - ax (
matplotlib.axes.Axes, optional) – The axes upon which to plot the curve. If None, the plot is drawn on a new set of axes. - figsize (2-tuple, optional) – Tuple denoting figure size of the plot
e.g. (6, 6). Defaults to
None. - cmap (string or
matplotlib.colors.Colormapinstance, optional) – Colormap used for plotting the projection. View Matplotlib Colormap documentation for available options. https://matplotlib.org/users/colormaps.html - title_fontsize (string or int, optional) – Matplotlib-style fontsizes. Use e.g. “small”, “medium”, “large” or integer-values. Defaults to “large”.
- text_fontsize (string or int, optional) – Matplotlib-style fontsizes. Use e.g. “small”, “medium”, “large” or integer-values. Defaults to “medium”.
Returns: - The axes on which the plot was
drawn.
Return type: ax (
matplotlib.axes.Axes)Example
>>> import scikitplot as skplt
>>> pca = PCA(random_state=1)
>>> pca.fit(X)
>>> skplt.decomposition.plot_pca_2d_projection(pca, X, y)
<matplotlib.axes._subplots.AxesSubplot object at 0x7fe967d64490>
>>> plt.show()
- clf – Fitted PCA instance that can