Estimators Module (API Reference)
The scikitplot.estimators module includes plots built specifically for
scikit-learn estimator (classifier/regressor) instances e.g. Random Forest.
You can use your own estimators, but these plots assume specific properties
shared by scikit-learn estimators. The specific requirements are documented per
function.
-
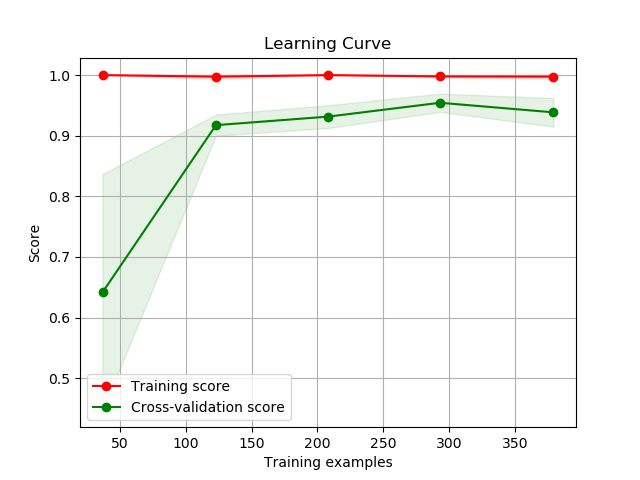
scikitplot.estimators.plot_learning_curve(clf, X, y, title=u'Learning Curve', cv=None, shuffle=False, random_state=None, train_sizes=None, n_jobs=1, scoring=None, ax=None, figsize=None, title_fontsize=u'large', text_fontsize=u'medium')¶ Generates a plot of the train and test learning curves for a classifier.
Parameters: - clf – Classifier instance that implements
fitandpredictmethods. - X (array-like, shape (n_samples, n_features)) – Training vector, where n_samples is the number of samples and n_features is the number of features.
- y (array-like, shape (n_samples) or (n_samples, n_features)) – Target relative to X for classification or regression; None for unsupervised learning.
- title (string, optional) – Title of the generated plot. Defaults to “Learning Curve”
- cv (int, cross-validation generator, iterable, optional) –
Determines the cross-validation strategy to be used for splitting.
- Possible inputs for cv are:
- None, to use the default 3-fold cross-validation,
- integer, to specify the number of folds.
- An object to be used as a cross-validation generator.
- An iterable yielding train/test splits.
For integer/None inputs, if
yis binary or multiclass,StratifiedKFoldused. If the estimator is not a classifier or ifyis neither binary nor multiclass,KFoldis used. - shuffle (bool, optional) – Used when do_cv is set to True. Determines whether to shuffle the training data before splitting using cross-validation. Default set to True.
- random_state (int
RandomState) – Pseudo-random number generator state used for random sampling. - train_sizes (iterable, optional) – Determines the training sizes used to
plot the learning curve. If None,
np.linspace(.1, 1.0, 5)is used. - n_jobs (int, optional) – Number of jobs to run in parallel. Defaults to 1.
- scoring (string, callable or None, optional) – default: None A string (see scikit-learn model evaluation documentation) or a scorerbcallable object / function with signature scorer(estimator, X, y).
- ax (
matplotlib.axes.Axes, optional) – The axes upon which to plot the curve. If None, the plot is drawn on a new set of axes. - figsize (2-tuple, optional) – Tuple denoting figure size of the plot
e.g. (6, 6). Defaults to
None. - title_fontsize (string or int, optional) – Matplotlib-style fontsizes. Use e.g. “small”, “medium”, “large” or integer-values. Defaults to “large”.
- text_fontsize (string or int, optional) – Matplotlib-style fontsizes. Use e.g. “small”, “medium”, “large” or integer-values. Defaults to “medium”.
Returns: - The axes on which the plot was
drawn.
Return type: ax (
matplotlib.axes.Axes)Example
>>> import scikitplot as skplt
>>> rf = RandomForestClassifier()
>>> skplt.estimators.plot_learning_curve(rf, X, y)
<matplotlib.axes._subplots.AxesSubplot object at 0x7fe967d64490>
>>> plt.show()
- clf – Classifier instance that implements
-
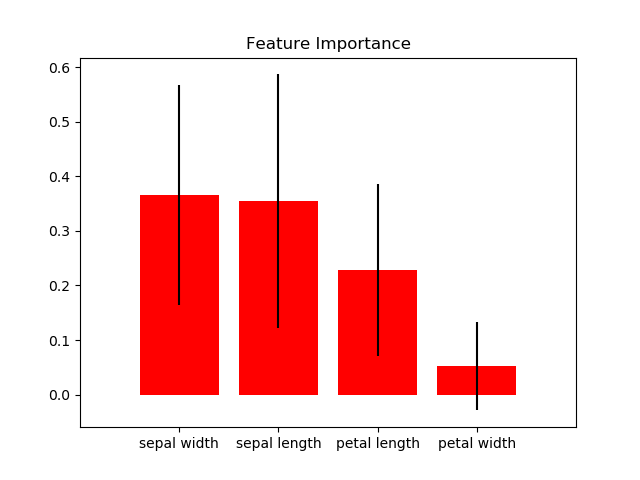
scikitplot.estimators.plot_feature_importances(clf, title=u'Feature Importance', feature_names=None, max_num_features=20, order=u'descending', x_tick_rotation=0, ax=None, figsize=None, title_fontsize=u'large', text_fontsize=u'medium')¶ Generates a plot of a classifier’s feature importances.
Parameters: - clf – Classifier instance that has a
feature_importances_attribute, e.g.sklearn.ensemble.RandomForestClassifierorxgboost.XGBClassifier. - title (string, optional) – Title of the generated plot. Defaults to “Feature importances”.
- feature_names (None,
listof string, optional) – Determines the feature names used to plot the feature importances. If None, feature names will be numbered. - max_num_features (int) – Determines the maximum number of features to plot. Defaults to 20.
- order ('ascending', 'descending', or None, optional) – Determines the order in which the feature importances are plotted. Defaults to ‘descending’.
- x_tick_rotation (int, optional) – Rotates x-axis tick labels by the specified angle. This is useful in cases where there are numerous categories and the labels overlap each other.
- ax (
matplotlib.axes.Axes, optional) – The axes upon which to plot the curve. If None, the plot is drawn on a new set of axes. - figsize (2-tuple, optional) – Tuple denoting figure size of the plot
e.g. (6, 6). Defaults to
None. - title_fontsize (string or int, optional) – Matplotlib-style fontsizes. Use e.g. “small”, “medium”, “large” or integer-values. Defaults to “large”.
- text_fontsize (string or int, optional) – Matplotlib-style fontsizes. Use e.g. “small”, “medium”, “large” or integer-values. Defaults to “medium”.
Returns: - The axes on which the plot was
drawn.
Return type: ax (
matplotlib.axes.Axes)Example
>>> import scikitplot as skplt
>>> rf = RandomForestClassifier()
>>> rf.fit(X, y)
>>> skplt.estimators.plot_feature_importances(
...     rf, feature_names=['petal length', 'petal width',
...                        'sepal length', 'sepal width'])
<matplotlib.axes._subplots.AxesSubplot object at 0x7fe967d64490>
>>> plt.show()
- clf – Classifier instance that has a