Factory API Reference
This document contains the plotting methods that are embedded into scikit-learn objects by the factory functions clustering_factory() and classifier_factory().
Important Note
If you want to use stand-alone functions and not bother with the factory functions, view the Functions API Reference instead.
Classifier Plots
-
scikitplot.classifier_factory(clf)¶ DEPRECATED: This will be removed in v0.4.0. The Factory API has been deprecated. Please migrate existing code into the various new modules of the Functions API. Please note that the interface of those functions will likely be different from that of the Factory API.
Embeds scikit-plot instance methods in an sklearn classifier.
- Args:
- clf: Scikit-learn classifier instance
- Returns:
- The same scikit-learn classifier instance passed in clf with embedded scikit-plot instance methods.
- Raises:
- ValueError: If clf does not contain the instance methods
- necessary for scikit-plot instance methods.
-
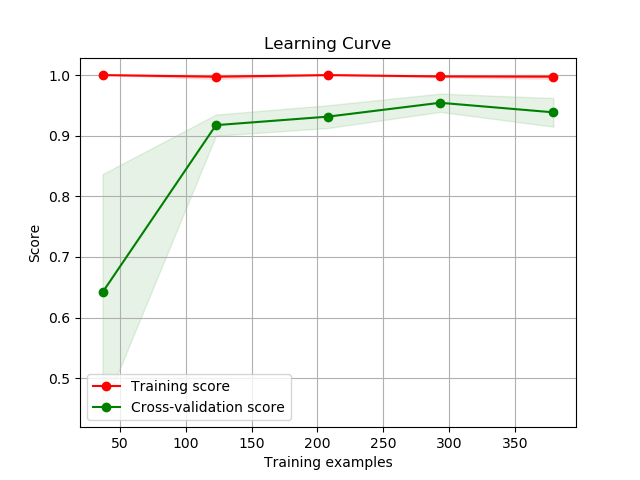
scikitplot.classifiers.plot_learning_curve(clf, X, y, title='Learning Curve', cv=None, train_sizes=None, n_jobs=1, scoring=None, ax=None, figsize=None, title_fontsize='large', text_fontsize='medium')¶ DEPRECATED: This will be removed in v0.4.0. Please use scikitplot.estimators.plot_learning_curve instead.
Generates a plot of the train and test learning curves for a classifier.
- Args:
- clf: Classifier instance that implements
fitandpredict - methods.
- X (array-like, shape (n_samples, n_features)):
- Training vector, where n_samples is the number of samples and n_features is the number of features.
- y (array-like, shape (n_samples) or (n_samples, n_features)):
- Target relative to X for classification or regression; None for unsupervised learning.
- title (string, optional): Title of the generated plot. Defaults to
- “Learning Curve”
- cv (int, cross-validation generator, iterable, optional): Determines
the cross-validation strategy to be used for splitting.
- Possible inputs for cv are:
- None, to use the default 3-fold cross-validation,
- integer, to specify the number of folds.
- An object to be used as a cross-validation generator.
- An iterable yielding train/test splits.
For integer/None inputs, if
yis binary or multiclass,StratifiedKFoldused. If the estimator is not a classifier or ifyis neither binary nor multiclass,KFoldis used.- train_sizes (iterable, optional): Determines the training sizes used to
- plot the learning curve. If None,
np.linspace(.1, 1.0, 5)is used. - n_jobs (int, optional): Number of jobs to run in parallel. Defaults to
- scoring (string, callable or None, optional): default: None
- A string (see scikit-learn model evaluation documentation) or a scorerbcallable object / function with signature scorer(estimator, X, y).
- ax (
matplotlib.axes.Axes, optional): The axes upon which to - plot the curve. If None, the plot is drawn on a new set of axes.
- figsize (2-tuple, optional): Tuple denoting figure size of the plot
- e.g. (6, 6). Defaults to
None. - title_fontsize (string or int, optional): Matplotlib-style fontsizes.
- Use e.g. “small”, “medium”, “large” or integer-values. Defaults to “large”.
- text_fontsize (string or int, optional): Matplotlib-style fontsizes.
- Use e.g. “small”, “medium”, “large” or integer-values. Defaults to “medium”.
- clf: Classifier instance that implements
- Returns:
- ax (
matplotlib.axes.Axes): The axes on which the plot was - drawn.
- ax (
- Example:
>>> import scikitplot.plotters as skplt
>>> rf = RandomForestClassifier()
>>> skplt.plot_learning_curve(rf, X, y)
<matplotlib.axes._subplots.AxesSubplot object at 0x7fe967d64490>
>>> plt.show()
-
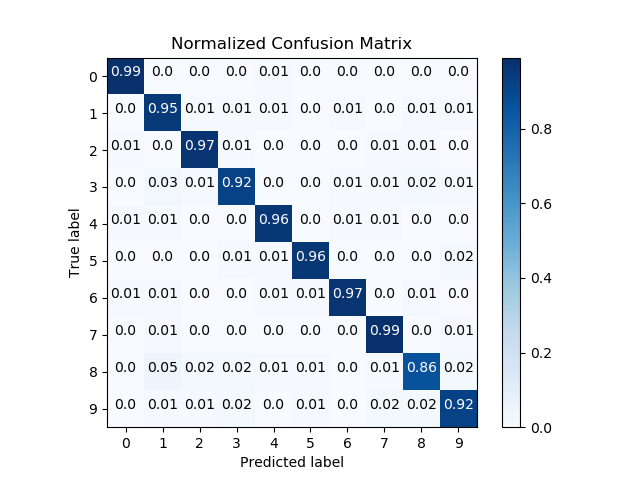
scikitplot.classifiers.plot_confusion_matrix_with_cv(clf, X, y, labels=None, true_labels=None, pred_labels=None, title=None, normalize=False, hide_zeros=False, x_tick_rotation=0, do_cv=True, cv=None, shuffle=True, random_state=None, ax=None, figsize=None, cmap='Blues', title_fontsize='large', text_fontsize='medium')¶ Generates the confusion matrix for a given classifier and dataset.
Parameters: - clf – Classifier instance that implements
fitandpredictmethods. - X (array-like, shape (n_samples, n_features)) – Training vector, where n_samples is the number of samples and n_features is the number of features.
- y (array-like, shape (n_samples) or (n_samples, n_features)) – Target relative to X for classification.
- labels (array-like, shape (n_classes), optional) – List of labels to
index the matrix. This may be used to reorder or select a subset of
labels. If none is given, those that appear at least once in
yare used in sorted order. (new in v0.2.5) - true_labels (array-like, optional) – The true labels to display. If none is given, then all of the labels are used.
- pred_labels (array-like, optional) – The predicted labels to display. If none is given, then all of the labels are used.
- title (string, optional) – Title of the generated plot. Defaults to “Confusion Matrix” if normalize` is True. Else, defaults to “Normalized Confusion Matrix.
- normalize (bool, optional) – If True, normalizes the confusion matrix before plotting. Defaults to False.
- hide_zeros (bool, optional) – If True, does not plot cells containing a value of zero. Defaults to False.
- x_tick_rotation (int, optional) – Rotates x-axis tick labels by the specified angle. This is useful in cases where there are numerous categories and the labels overlap each other.
- do_cv (bool, optional) – If True, the classifier is cross-validated on the dataset using the cross-validation strategy in cv to generate the confusion matrix. If False, the confusion matrix is generated without training or cross-validating the classifier. This assumes that the classifier has already been called with its fit method beforehand.
- cv (int, cross-validation generator, iterable, optional) –
Determines the cross-validation strategy to be used for splitting.
- Possible inputs for cv are:
- None, to use the default 3-fold cross-validation,
- integer, to specify the number of folds.
- An object to be used as a cross-validation generator.
- An iterable yielding train/test splits.
For integer/None inputs, if
yis binary or multiclass,StratifiedKFoldused. If the estimator is not a classifier or ifyis neither binary nor multiclass,KFoldis used. - shuffle (bool, optional) – Used when do_cv is set to True. Determines whether to shuffle the training data before splitting using cross-validation. Default set to True.
- random_state (int
RandomState) – Pseudo-random number generator state used for random sampling. - ax (
matplotlib.axes.Axes, optional) – The axes upon which to plot the learning curve. If None, the plot is drawn on a new set of axes. - figsize (2-tuple, optional) – Tuple denoting figure size of the plot
e.g. (6, 6). Defaults to
None. - cmap (string or
matplotlib.colors.Colormapinstance, optional) – Colormap used for plotting the projection. View Matplotlib Colormap documentation for available options. https://matplotlib.org/users/colormaps.html - title_fontsize (string or int, optional) – Matplotlib-style fontsizes. Use e.g. “small”, “medium”, “large” or integer-values. Defaults to “large”.
- text_fontsize (string or int, optional) – Matplotlib-style fontsizes. Use e.g. “small”, “medium”, “large” or integer-values. Defaults to “medium”.
Returns: - The axes on which the plot was
drawn.
Return type: ax (
matplotlib.axes.Axes)Example
>>> rf = classifier_factory(RandomForestClassifier())
>>> rf.plot_confusion_matrix(X, y, normalize=True)
<matplotlib.axes._subplots.AxesSubplot object at 0x7fe967d64490>
>>> plt.show()
- clf – Classifier instance that implements
-
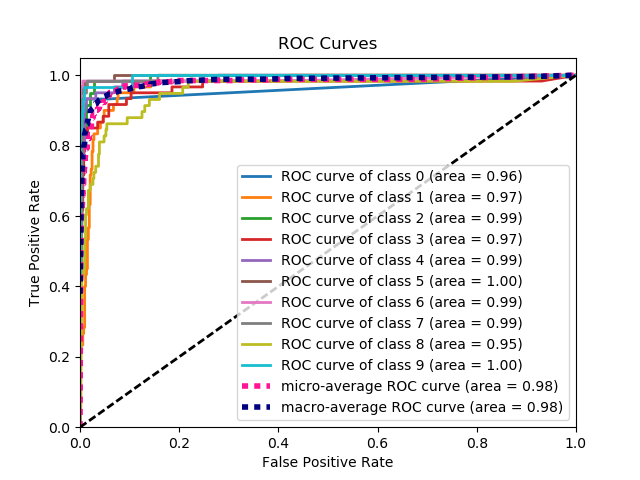
scikitplot.classifiers.plot_roc_curve_with_cv(clf, X, y, title='ROC Curves', do_cv=True, cv=None, shuffle=True, random_state=None, curves=('micro', 'macro', 'each_class'), ax=None, figsize=None, cmap='nipy_spectral', title_fontsize='large', text_fontsize='medium')¶ Generates the ROC curves for a given classifier and dataset.
Parameters: - clf – Classifier instance that implements
fitandpredictmethods. - X (array-like, shape (n_samples, n_features)) – Training vector, where n_samples is the number of samples and n_features is the number of features.
- y (array-like, shape (n_samples) or (n_samples, n_features)) – Target relative to X for classification.
- title (string, optional) – Title of the generated plot. Defaults to “ROC Curves”.
- do_cv (bool, optional) – If True, the classifier is cross-validated on the dataset using the cross-validation strategy in cv to generate the confusion matrix. If False, the confusion matrix is generated without training or cross-validating the classifier. This assumes that the classifier has already been called with its fit method beforehand.
- cv (int, cross-validation generator, iterable, optional) –
Determines the cross-validation strategy to be used for splitting.
- Possible inputs for cv are:
- None, to use the default 3-fold cross-validation,
- integer, to specify the number of folds.
- An object to be used as a cross-validation generator.
- An iterable yielding train/test splits.
For integer/None inputs, if
yis binary or multiclass,StratifiedKFoldused. If the estimator is not a classifier or ifyis neither binary nor multiclass,KFoldis used. - shuffle (bool, optional) – Used when do_cv is set to True. Determines whether to shuffle the training data before splitting using cross-validation. Default set to True.
- random_state (int
RandomState) – Pseudo-random number generator state used for random sampling. - curves (array-like) – A listing of which curves should be plotted on the resulting plot. Defaults to (“micro”, “macro”, “each_class”) i.e. “micro” for micro-averaged curve, “macro” for macro-averaged curve
- ax (
matplotlib.axes.Axes, optional) – The axes upon which to plot the learning curve. If None, the plot is drawn on a new set of axes. - figsize (2-tuple, optional) – Tuple denoting figure size of the plot
e.g. (6, 6). Defaults to
None. - cmap (string or
matplotlib.colors.Colormapinstance, optional) – Colormap used for plotting the projection. View Matplotlib Colormap documentation for available options. https://matplotlib.org/users/colormaps.html - title_fontsize (string or int, optional) – Matplotlib-style fontsizes. Use e.g. “small”, “medium”, “large” or integer-values. Defaults to “large”.
- text_fontsize (string or int, optional) – Matplotlib-style fontsizes. Use e.g. “small”, “medium”, “large” or integer-values. Defaults to “medium”.
Returns: - The axes on which the plot was
drawn.
Return type: ax (
matplotlib.axes.Axes)Example
>>> nb = classifier_factory(GaussianNB())
>>> nb.plot_roc_curve(X, y, random_state=1)
<matplotlib.axes._subplots.AxesSubplot object at 0x7fe967d64490>
>>> plt.show()
- clf – Classifier instance that implements
-
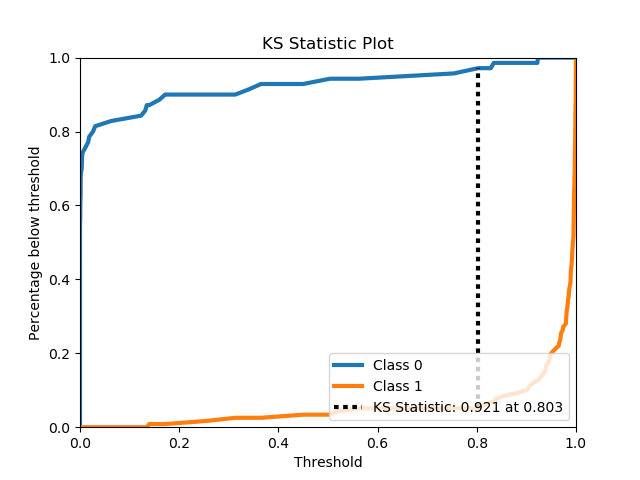
scikitplot.classifiers.plot_ks_statistic_with_cv(clf, X, y, title='KS Statistic Plot', do_cv=True, cv=None, shuffle=True, random_state=None, ax=None, figsize=None, title_fontsize='large', text_fontsize='medium')¶ Generates the KS Statistic plot for a given classifier and dataset.
Parameters: - clf – Classifier instance that implements “fit” and “predict_proba” methods.
- X (array-like, shape (n_samples, n_features)) – Training vector, where n_samples is the number of samples and n_features is the number of features.
- y (array-like, shape (n_samples) or (n_samples, n_features)) – Target relative to X for classification.
- title (string, optional) – Title of the generated plot. Defaults to “KS Statistic Plot”.
- do_cv (bool, optional) – If True, the classifier is cross-validated on the dataset using the cross-validation strategy in cv to generate the confusion matrix. If False, the confusion matrix is generated without training or cross-validating the classifier. This assumes that the classifier has already been called with its fit method beforehand.
- cv (int, cross-validation generator, iterable, optional) –
Determines the cross-validation strategy to be used for splitting.
- Possible inputs for cv are:
- None, to use the default 3-fold cross-validation,
- integer, to specify the number of folds.
- An object to be used as a cross-validation generator.
- An iterable yielding train/test splits.
For integer/None inputs, if
yis binary or multiclass,StratifiedKFoldused. If the estimator is not a classifier or ifyis neither binary nor multiclass,KFoldis used. - shuffle (bool, optional) – Used when do_cv is set to True. Determines whether to shuffle the training data before splitting using cross-validation. Default set to True.
- random_state (int
RandomState) – Pseudo-random number generator state used for random sampling. - ax (
matplotlib.axes.Axes, optional) – The axes upon which to plot the learning curve. If None, the plot is drawn on a new set of axes. - figsize (2-tuple, optional) – Tuple denoting figure size of the plot
e.g. (6, 6). Defaults to
None. - title_fontsize (string or int, optional) – Matplotlib-style fontsizes. Use e.g. “small”, “medium”, “large” or integer-values. Defaults to “large”.
- text_fontsize (string or int, optional) – Matplotlib-style fontsizes. Use e.g. “small”, “medium”, “large” or integer-values. Defaults to “medium”.
Returns: - The axes on which the plot was
drawn.
Return type: ax (
matplotlib.axes.Axes)Example
>>> lr = classifier_factory(LogisticRegression())
>>> lr.plot_ks_statistic(X, y, random_state=1)
<matplotlib.axes._subplots.AxesSubplot object at 0x7fe967d64490>
>>> plt.show()
-
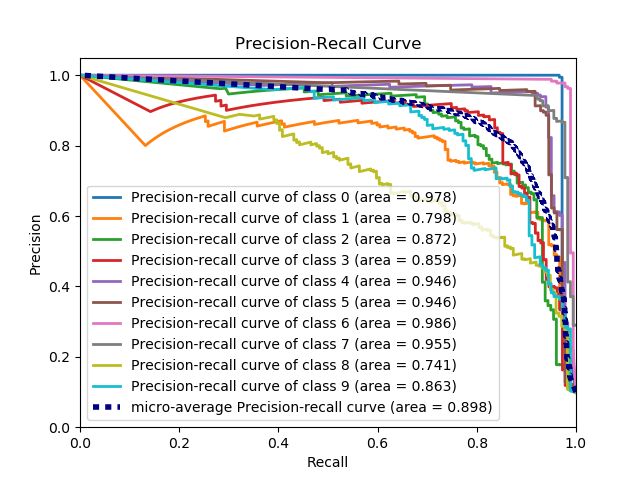
scikitplot.classifiers.plot_precision_recall_curve_with_cv(clf, X, y, title='Precision-Recall Curve', do_cv=True, cv=None, shuffle=True, random_state=None, curves=('micro', 'each_class'), ax=None, figsize=None, cmap='nipy_spectral', title_fontsize='large', text_fontsize='medium')¶ Generates the Precision-Recall curve for a given classifier and dataset.
Parameters: - clf – Classifier instance that implements “fit” and “predict_proba” methods.
- X (array-like, shape (n_samples, n_features)) – Training vector, where n_samples is the number of samples and n_features is the number of features.
- y (array-like, shape (n_samples) or (n_samples, n_features)) – Target relative to X for classification.
- title (string, optional) – Title of the generated plot. Defaults to “Precision-Recall Curve”.
- do_cv (bool, optional) – If True, the classifier is cross-validated on the dataset using the cross-validation strategy in cv to generate the confusion matrix. If False, the confusion matrix is generated without training or cross-validating the classifier. This assumes that the classifier has already been called with its fit method beforehand.
- cv (int, cross-validation generator, iterable, optional) –
Determines the cross-validation strategy to be used for splitting.
- Possible inputs for cv are:
- None, to use the default 3-fold cross-validation,
- integer, to specify the number of folds.
- An object to be used as a cross-validation generator.
- An iterable yielding train/test splits.
For integer/None inputs, if
yis binary or multiclass,StratifiedKFoldused. If the estimator is not a classifier or ifyis neither binary nor multiclass,KFoldis used. - shuffle (bool, optional) – Used when do_cv is set to True. Determines whether to shuffle the training data before splitting using cross-validation. Default set to True.
- random_state (int
RandomState) – Pseudo-random number generator state used for random sampling. - curves (array-like) – A listing of which curves should be plotted on the resulting plot. Defaults to (“micro”, “each_class”) i.e. “micro” for micro-averaged curve
- ax (
matplotlib.axes.Axes, optional) – The axes upon which to plot the learning curve. If None, the plot is drawn on a new set of axes. - figsize (2-tuple, optional) – Tuple denoting figure size of the plot
e.g. (6, 6). Defaults to
None. - cmap (string or
matplotlib.colors.Colormapinstance, optional) – Colormap used for plotting the projection. View Matplotlib Colormap documentation for available options. https://matplotlib.org/users/colormaps.html - title_fontsize (string or int, optional) – Matplotlib-style fontsizes. Use e.g. “small”, “medium”, “large” or integer-values. Defaults to “large”.
- text_fontsize (string or int, optional) – Matplotlib-style fontsizes. Use e.g. “small”, “medium”, “large” or integer-values. Defaults to “medium”.
Returns: - The axes on which the plot was
drawn.
Return type: ax (
matplotlib.axes.Axes)Example
>>> nb = classifier_factory(GaussianNB())
>>> nb.plot_precision_recall_curve(X, y, random_state=1)
<matplotlib.axes._subplots.AxesSubplot object at 0x7fe967d64490>
>>> plt.show()
-
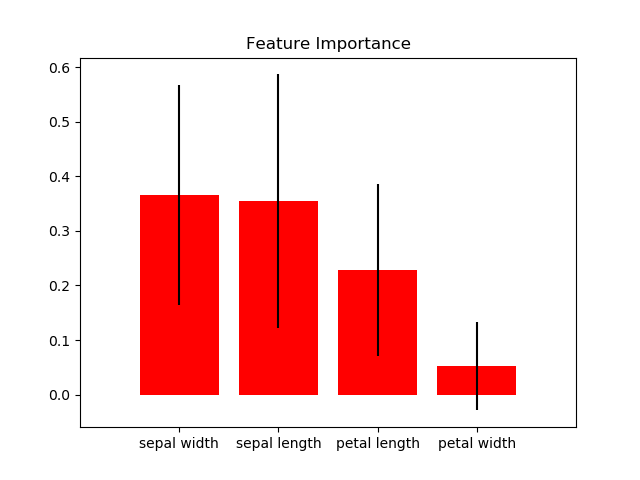
scikitplot.classifiers.plot_feature_importances(clf, title='Feature Importance', feature_names=None, max_num_features=20, order='descending', x_tick_rotation=0, ax=None, figsize=None, title_fontsize='large', text_fontsize='medium')¶ DEPRECATED: This will be removed in v0.4.0. Please use scikitplot.estimators.plot_feature_importances instead.
Generates a plot of a classifier’s feature importances.
- Args:
- clf: Classifier instance that implements
fitandpredict_proba - methods. The classifier must also have a
feature_importances_attribute. - title (string, optional): Title of the generated plot. Defaults to
- “Feature importances”.
- feature_names (None,
listof string, optional): Determines the - feature names used to plot the feature importances. If None, feature names will be numbered.
- max_num_features (int): Determines the maximum number of features to
- plot. Defaults to 20.
- order (‘ascending’, ‘descending’, or None, optional): Determines the
- order in which the feature importances are plotted. Defaults to ‘descending’.
- x_tick_rotation (int, optional): Rotates x-axis tick labels by the
- specified angle. This is useful in cases where there are numerous categories and the labels overlap each other.
- ax (
matplotlib.axes.Axes, optional): The axes upon which to - plot the curve. If None, the plot is drawn on a new set of axes.
- figsize (2-tuple, optional): Tuple denoting figure size of the plot
- e.g. (6, 6). Defaults to
None. - title_fontsize (string or int, optional): Matplotlib-style fontsizes.
- Use e.g. “small”, “medium”, “large” or integer-values. Defaults to “large”.
- text_fontsize (string or int, optional): Matplotlib-style fontsizes.
- Use e.g. “small”, “medium”, “large” or integer-values. Defaults to “medium”.
- clf: Classifier instance that implements
- Returns:
- ax (
matplotlib.axes.Axes): The axes on which the plot was - drawn.
- ax (
- Example:
>>> import scikitplot.plotters as skplt
>>> rf = RandomForestClassifier()
>>> rf.fit(X, y)
>>> skplt.plot_feature_importances(
...     rf, feature_names=['petal length', 'petal width',
...                        'sepal length', 'sepal width'])
<matplotlib.axes._subplots.AxesSubplot object at 0x7fe967d64490>
>>> plt.show()
Clustering Plots
-
scikitplot.clustering_factory(clf)¶ DEPRECATED: This will be removed in v0.4.0. The Factory API has been deprecated. Please migrate existing code into the various new modules of the Functions API. Please note that the interface of those functions will likely be different from that of the Factory API.
Embeds scikit-plot plotting methods in an sklearn clusterer instance.
- Args:
- clf: Scikit-learn clusterer instance
- Returns:
- The same scikit-learn clusterer instance passed in clf with embedded scikit-plot instance methods.
- Raises:
- ValueError: If clf does not contain the instance methods necessary
- for scikit-plot instance methods.
-
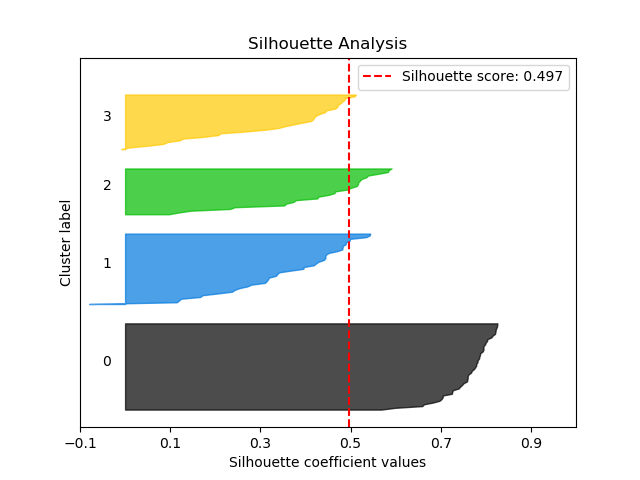
scikitplot.clustering.plot_silhouette(clf, X, title='Silhouette Analysis', metric='euclidean', copy=True, ax=None, figsize=None, cmap='nipy_spectral', title_fontsize='large', text_fontsize='medium')¶ DEPRECATED: This will be removed in v0.4.0. Please use scikitplot.metrics.plot_silhouette instead.
Plots silhouette analysis of clusters using fit_predict.
- Args:
- clf: Clusterer instance that implements
fitandfit_predict - methods.
- X (array-like, shape (n_samples, n_features)):
- Data to cluster, where n_samples is the number of samples and n_features is the number of features.
- title (string, optional): Title of the generated plot. Defaults to
- “Silhouette Analysis”
- metric (string or callable, optional): The metric to use when
- calculating distance between instances in a feature array. If metric is a string, it must be one of the options allowed by sklearn.metrics.pairwise.pairwise_distances. If X is the distance array itself, use “precomputed” as the metric.
- copy (boolean, optional): Determines whether
fitis used on - clf or on a copy of clf.
- ax (
matplotlib.axes.Axes, optional): The axes upon which to - plot the curve. If None, the plot is drawn on a new set of axes.
- figsize (2-tuple, optional): Tuple denoting figure size of the plot
- e.g. (6, 6). Defaults to
None. - cmap (string or
matplotlib.colors.Colormapinstance, optional): - Colormap used for plotting the projection. View Matplotlib Colormap documentation for available options. https://matplotlib.org/users/colormaps.html
- title_fontsize (string or int, optional): Matplotlib-style fontsizes.
- Use e.g. “small”, “medium”, “large” or integer-values. Defaults to “large”.
- text_fontsize (string or int, optional): Matplotlib-style fontsizes.
- Use e.g. “small”, “medium”, “large” or integer-values. Defaults to “medium”.
- clf: Clusterer instance that implements
- Returns:
- ax (
matplotlib.axes.Axes): The axes on which the plot was - drawn.
- ax (
- Example:
>>> import scikitplot.plotters as skplt
>>> kmeans = KMeans(n_clusters=4, random_state=1)
>>> skplt.plot_silhouette(kmeans, X)
<matplotlib.axes._subplots.AxesSubplot object at 0x7fe967d64490>
>>> plt.show()
-
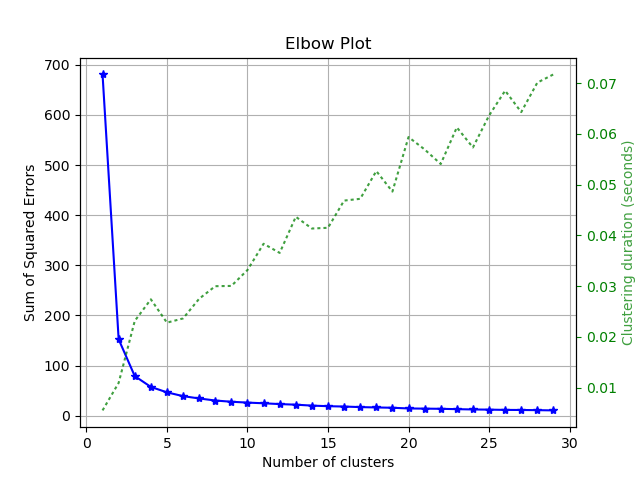
scikitplot.clustering.plot_elbow_curve(clf, X, title='Elbow Plot', cluster_ranges=None, ax=None, figsize=None, title_fontsize='large', text_fontsize='medium')¶ DEPRECATED: This will be removed in v0.4.0. Please use scikitplot.cluster.plot_elbow_curve instead.
Plots elbow curve of different values of K for KMeans clustering.
- Args:
- clf: Clusterer instance that implements
fitandfit_predict - methods and a
scoreparameter. - X (array-like, shape (n_samples, n_features)):
- Data to cluster, where n_samples is the number of samples and n_features is the number of features.
- title (string, optional): Title of the generated plot. Defaults to
- “Elbow Plot”
- cluster_ranges (None or
listof int, optional): List of - n_clusters for which to plot the explained variances. Defaults to
range(1, 12, 2). - copy (boolean, optional): Determines whether
fitis used on - clf or on a copy of clf.
- ax (
matplotlib.axes.Axes, optional): The axes upon which to - plot the curve. If None, the plot is drawn on a new set of axes.
- figsize (2-tuple, optional): Tuple denoting figure size of the plot
- e.g. (6, 6). Defaults to
None. - title_fontsize (string or int, optional): Matplotlib-style fontsizes.
- Use e.g. “small”, “medium”, “large” or integer-values. Defaults to “large”.
- text_fontsize (string or int, optional): Matplotlib-style fontsizes.
- Use e.g. “small”, “medium”, “large” or integer-values. Defaults to “medium”.
- clf: Clusterer instance that implements
- Returns:
- ax (
matplotlib.axes.Axes): The axes on which the plot was - drawn.
- ax (
- Example:
>>> import scikitplot.plotters as skplt
>>> kmeans = KMeans(random_state=1)
>>> skplt.plot_elbow_curve(kmeans, cluster_ranges=range(1, 11))
<matplotlib.axes._subplots.AxesSubplot object at 0x7fe967d64490>
>>> plt.show()